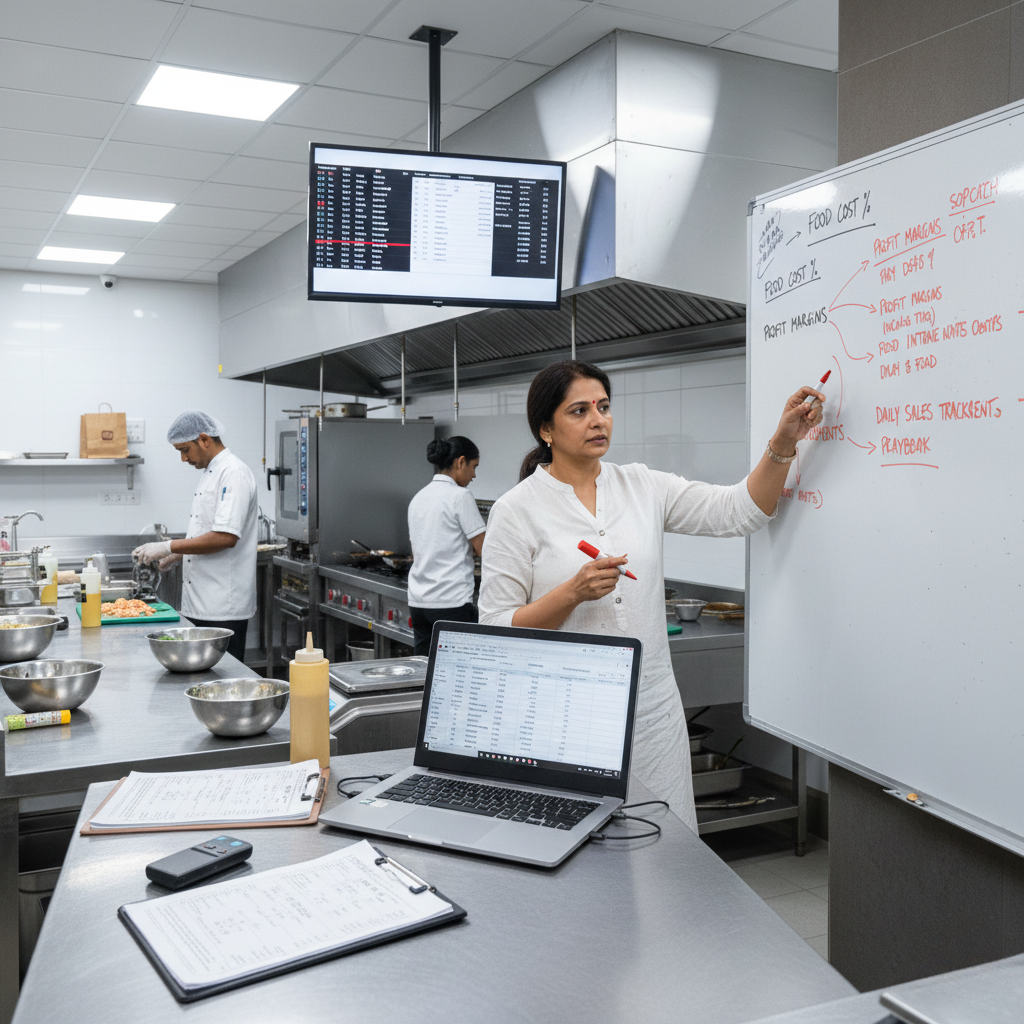
Cloud Kitchen Profitability Dashboard-it is a decision-making system. Many cloud kitchens operate with strong daily order volumes and growing brand visibility, yet struggle to understand why profits fluctuate from month to month. Without structured visibility into the right performance indicators, revenue growth can create operational pressure instead of financial stability.
Tracking the right data consistently transforms guesswork into clarity. A well-designed profitability dashboard allows founders to identify margin movement early, adjust operations proactively, and align growth with sustainable financial outcomes.
Why a Profitability Dashboard Is Essential for Cloud Kitchens
Revenue alone does not define success. Contribution, cost stability, and efficiency determine sustainability. As discussed in Cloud Kitchen Profitability Data-Driven Approach and why cloud kitchen profits decline despite good sales , high order volumes without margin control can silently erode profitability.
A dashboard centralizes operational and financial metrics into a single, structured view. Instead of reviewing scattered reports or reacting at month-end, founders gain daily visibility into the financial health of their kitchen.
Contribution Margin Visibility as the Dashboard Foundation
The primary metric in any cloud kitchen profitability dashboard is contribution margin. It reveals how much revenue remains after covering variable costs such as ingredients, packaging, aggregator commissions, discounts, and advertising spend.
Contribution Margin = Selling Price − Variable Costs
Without contribution tracking at SKU or category level, kitchens may scale items that increase workload without strengthening margins.

A structured dashboard highlights which menu segments consistently generate healthy contribution and which require pricing or portion optimization.
Monitoring Food Cost Percentage in Real Time
Food cost percentage is one of the most sensitive profitability indicators. Even minor deviations in portion control or yield calculations can significantly impact monthly margins.
Food Cost % = (Total Ingredient Cost / Total Sales) × 100
A dashboard that tracks daily food cost movement prevents slow drift from becoming a structural problem.

When food cost is visible daily, recipe standardization and waste reduction become measurable rather than theoretical.
Labor Efficiency and Demand Alignment
Labor expenses must align with demand patterns. Staffing decisions based on habit rather than data often result in idle payroll during slow periods and pressure during peak hours.
Labor Cost % = (Total Staff Cost / Total Revenue) × 100
A profitability dashboard compares hourly order trends with staffing levels, allowing operators to adjust shifts based on real demand rather than assumption.
This alignment increases productivity while stabilizing operational stress.
Understanding the Impact of Discounts and Promotions
Discounting influences revenue perception but may compress margins if not analyzed correctly. A structured dashboard tracks discount-to-sales ratio and post-discount contribution margin to ensure promotions support profitability rather than undermine it.
Operational risks associated with aggressive discounting are discussed further in data-driven cloud kitchen consulting services .
Visibility into discount performance transforms promotions from emotional decisions into strategic tools.
Inventory Tracking and Capital Protection
Inventory turnover directly impacts food cost stability and working capital efficiency. Without visibility into consumption patterns and stock velocity, over-purchasing and spoilage gradually weaken margins.
A dashboard that integrates inventory tracking ensures procurement decisions align with demand forecasts, protecting capital while maintaining operational readiness.
The Power of Daily Monitoring Over Monthly Review
Profitability challenges rarely emerge suddenly. They accumulate through small inefficiencies over time. A cloud kitchen profitability dashboard shifts focus from reactive monthly reviews to proactive daily monitoring.
Daily contribution summaries, food cost tracking, labor alignment data, and discount impact visibility allow founders to intervene before small drifts compound into major losses.
Consistency in monitoring builds predictability in financial outcomes.
Turning Data Into Structured Execution
Data alone does not improve profit. Execution discipline transforms insights into results. Recipe standardization, clearly defined kitchen roles, demand-aligned staffing, and contribution dashboards ensure that numbers influence operational behavior.
When the dashboard becomes a daily reference point, profitability shifts from reactive management to structured control.
Long-Term Success Through Dashboard Discipline
Sustainable cloud kitchen profitability is achieved when contribution visibility, food cost stability, labor efficiency, discount discipline, and inventory control operate cohesively.
A structured dashboard ensures these elements remain aligned as the business scales. Growth then becomes a reinforcement of stability rather than a source of financial stress.
Final Thoughts on Cloud Kitchen Profitability Dashboards
A profitability dashboard is not a complex accounting tool. It is a clarity system. When the right data is tracked consistently, founders gain control over margin movement, operational efficiency, and long-term sustainability.
Profit is not accidental. It is engineered through visibility, interpretation, and disciplined execution.
Frequently Asked Questions
What should a cloud kitchen profitability dashboard include?
A profitability dashboard should include contribution margin tracking, food cost percentage, labor cost ratio, discount-to-sales ratio, inventory turnover visibility, and daily revenue summaries. These metrics collectively provide a complete view of financial health.
How often should profitability data be reviewed?
Daily monitoring is ideal for operational stability. While monthly financial statements provide broader insights, daily dashboard review prevents gradual margin drift.
Can small cloud kitchens benefit from a profitability dashboard?
Yes. Even single-location kitchens benefit from structured visibility. Early adoption of dashboard discipline creates long-term scalability advantages.
Does a dashboard replace accounting systems?
No. A dashboard complements accounting systems by providing real-time operational insights rather than historical financial summaries.
Still Have Questions?
For operational and profitability guidance, read the Grow Kitchen FAQs .
You may also explore:
- Cloud Kitchen Profitability Audit
- How to Maximize Cloud Kitchen Profit with Data-Driven Approach
- How to Increase Cloud Kitchen Profitability
- How to Scale Your Cloud Kitchen for Profit
- Top Data Points for Cloud Kitchen Profitability