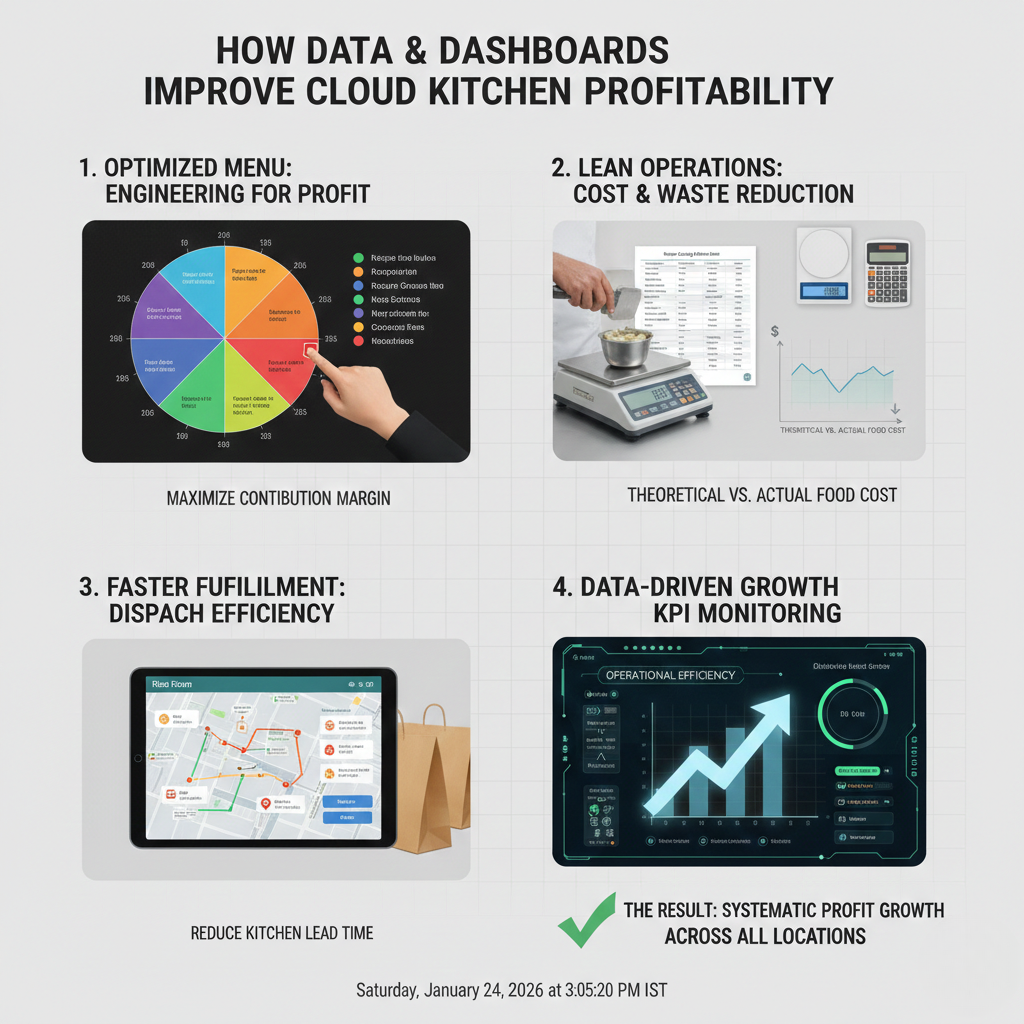
How Data & Dashboards Improve Cloud Kitchen Profitablity. They fail because founders operate blind without clear data, without dashboards, and without daily visibility into margins, refunds, delays, and ratings. This guide explains how data and dashboards improve cloud kitchen profitability, what metrics actually matter (and which don’t), how dashboards prevent silent leakage, and how small food brands can use simple data systems to move from firefighting to predictable profit.
Start Here Before Using Data to Improve Cloud Kitchen Profitability
This article is part of GrowKitchen’s profitability and operations learning series. If you’re new to delivery-first food businesses, start with: Cloud Kitchen Business in India.
Data only works when compliance and process discipline exist. Dashboards depend on clean billing, hygiene logs, and inventory records. Align your operations with FSSAI, structured training via FoSTaC, and tax discipline through the GST Network.
How Data & Dashboards Improve Cloud Kitchen Profitability
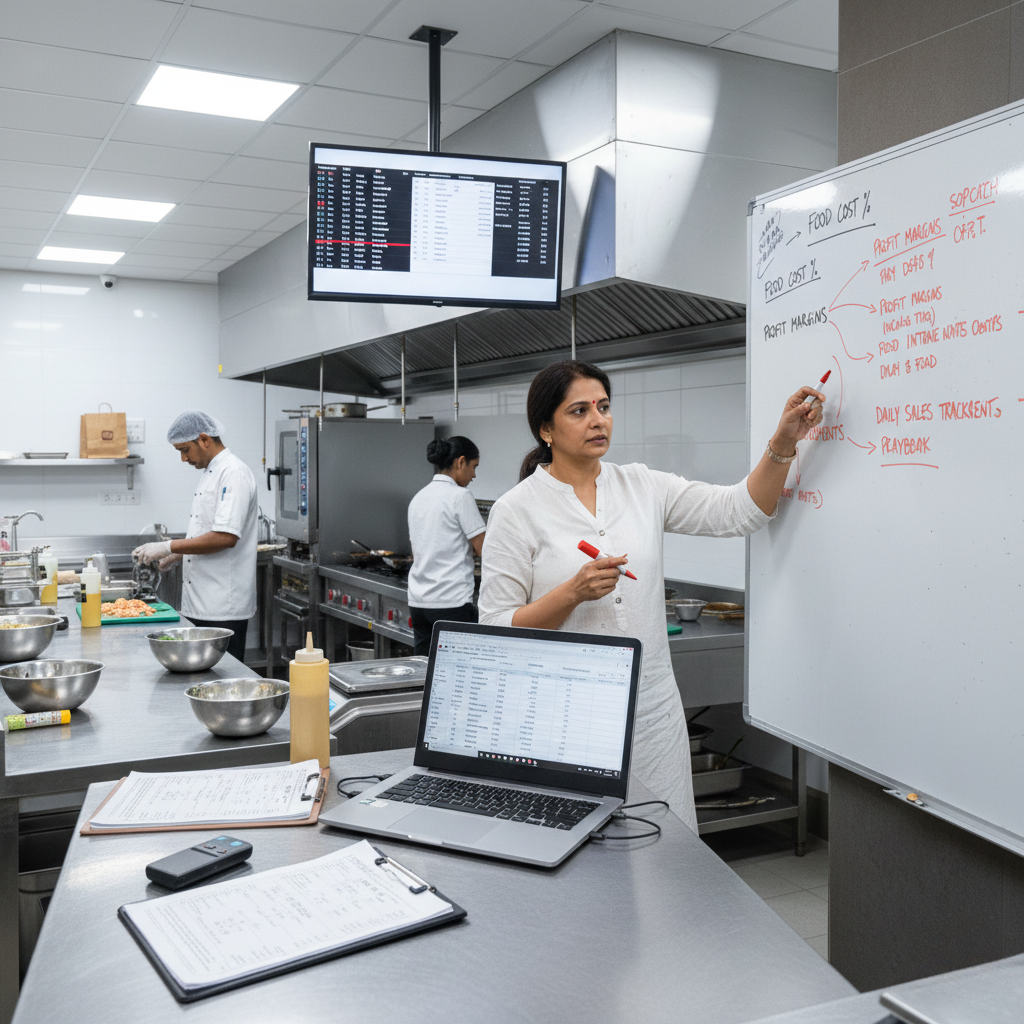
Many founders track sales. Very few track profitability. And almost none track the operational reasons behind profit erosion.
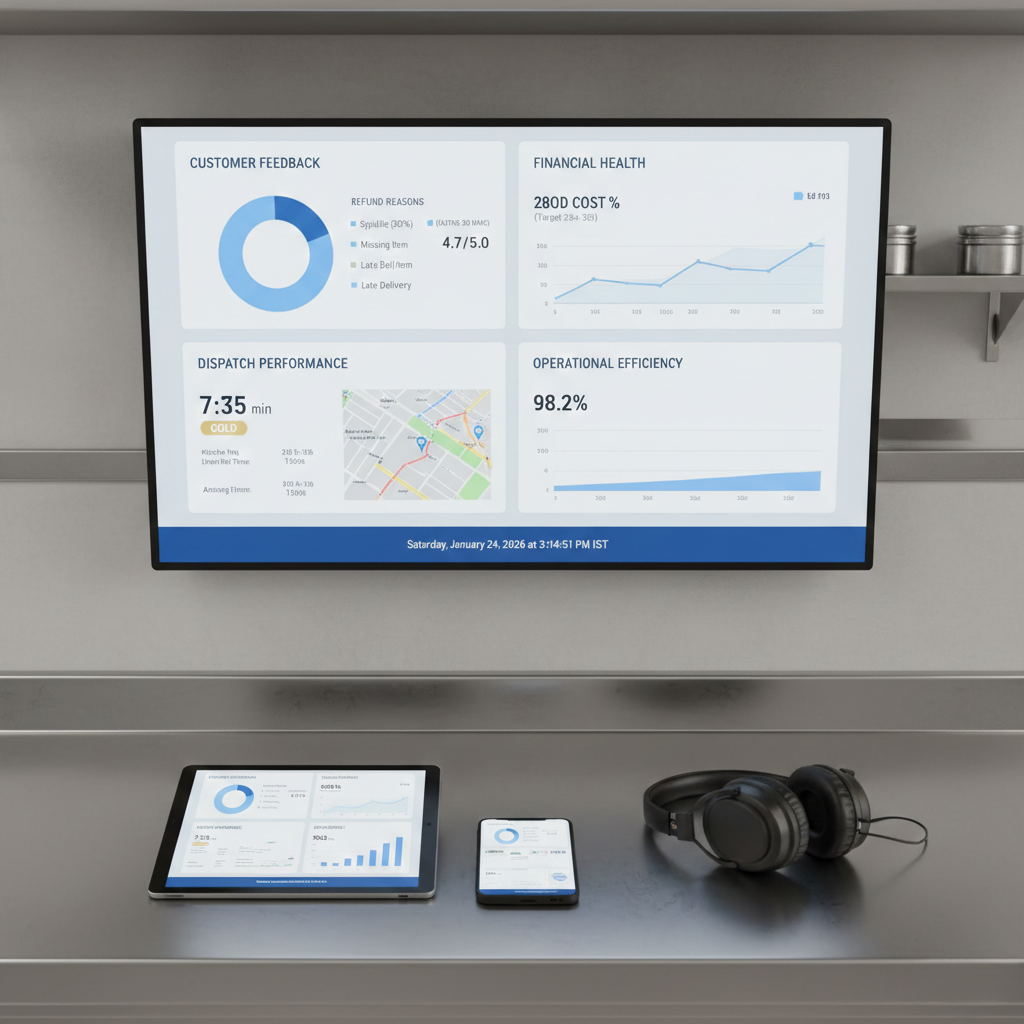
Data and dashboards improve cloud kitchen profitability by making invisible problems visible: portion drift, refunds, delay spikes, SKU drag, inventory leakage, and rating volatility.
A dashboard is not about complex analytics. It is about answering one question daily: “Where is money leaking today and why?”
Why Sales Data Alone Does Not Improve Profitability
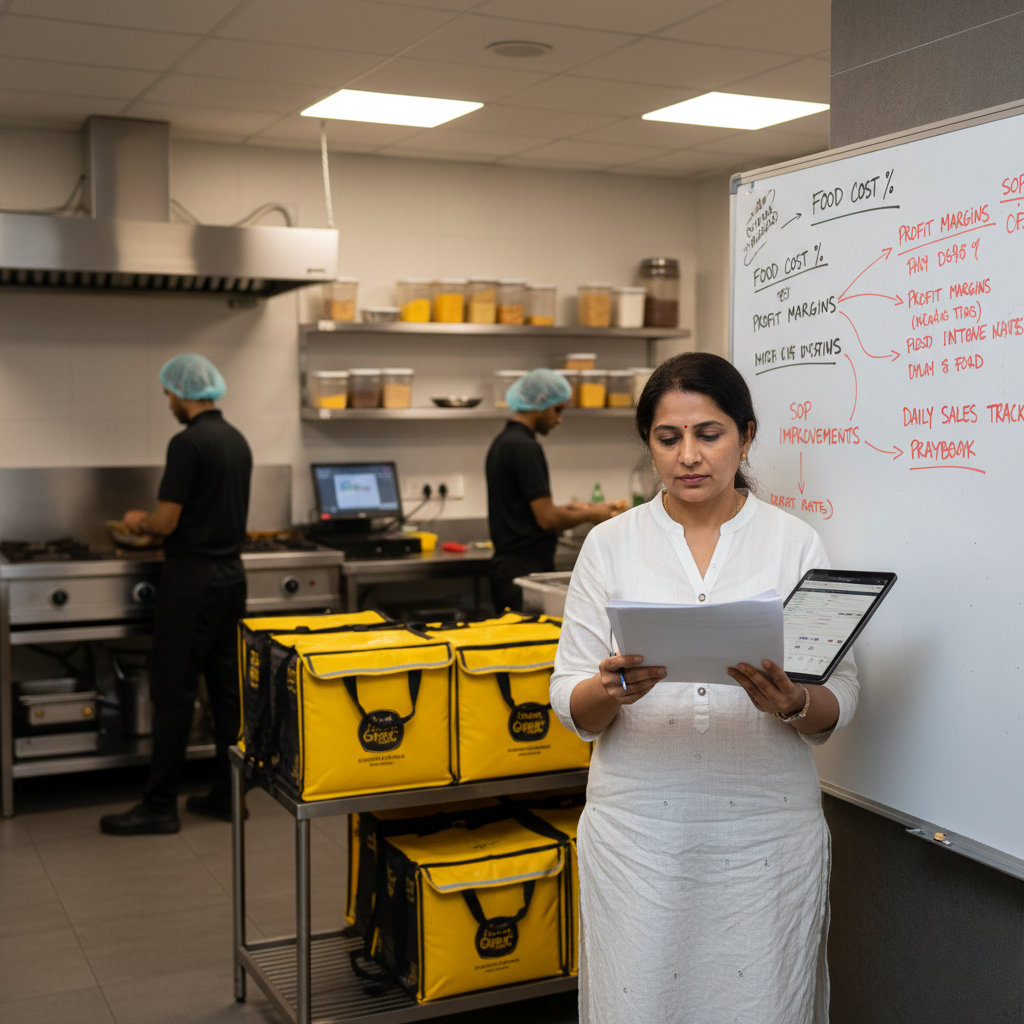
Most cloud kitchens rely on aggregator dashboards. These dashboards show orders, revenue, and ads. They do not show operational truth.
Sales can increase while profits fall. This happens when:
- High-refund SKUs grow faster than profitable SKUs
- Packaging costs rise unnoticed
- Discounts eat contribution margin
- Dispatch delays trigger refunds and rating drops
- Inventory wastage grows silently
This is why many kitchens with ₹8–10L monthly revenue still struggle to pay salaries.
To understand operational blind spots, read: Why Cloud Kitchens Fail in India.
The Only Data That Actually Improves Cloud Kitchen Profitability
Dashboards fail when they track everything. Profitable kitchens track only what drives margin and ratings.
1. Contribution Margin per Order
Profitability starts with contribution margin not revenue. Every dashboard must show:
- Food cost per order
- Packaging cost
- Aggregator commission
- Discount impact
- Net contribution per order
2. Refund Rate & Refund Reasons
Refunds are pure profit killers. Dashboards should classify refunds by reason: missing item, leakage, cold food, delay, wrong order.
3. Ratings Volatility (Not Just Average)
A stable 4.2 rating is healthier than a fluctuating 4.6. Dashboards should track:
- Weekly rating variance
- Low-star review spikes
- Correlation with delays or refunds
4. Dispatch Time & Ticket Aging
Delays create refunds, bad ratings, and lower visibility. Dashboards should highlight:
- Average prep + pack time
- Peak-hour delay spikes
- Orders crossing SLA thresholds
5. Inventory Variance
Inventory dashboards expose silent leakage. Track:
- Expected vs actual usage
- High-variance ingredients
- Wastage vs sales correlation
How Dashboards Change Daily Decision-Making in Cloud Kitchens
Without dashboards, founders react emotionally: discounts today, ads tomorrow, menu changes next week.
With dashboards, decisions become structured:
- Low-margin SKUs are trimmed
- High-refund SKUs are fixed or removed
- Packing SOPs are corrected based on data
- Peak-hour staffing is adjusted logically
- Ads are scaled only on profitable SKUs
This shift from reaction to rhythm is what improves profitability sustainably.
Learn how data fits into operations systems: Cloud Kitchen Operations Framework.
Simple Dashboard Stack for Small Cloud Kitchens
You don’t need expensive BI tools. Most profitable small kitchens use:
- Google Sheets or Excel for costing & inventory
- Aggregator exports for order & refund data
- Weekly KPI review templates
- Daily operations scorecards
The power is not the tool. The power is the review rhythm.
If you want SOP-driven structure before dashboards, start with: Cloud Kitchen SOP Checklist.
Common Data & Dashboard Mistakes That Kill Profitability
- Tracking too many metrics with no action plan
- Looking at monthly data instead of weekly
- Ignoring refund reasons
- Not linking dashboards to SOP changes
- Founder-only dashboards with no team visibility
Data without action is noise. Dashboards must trigger operational corrections.
Final Thoughts: Data Is the Profit Multiplier
Data and dashboards don’t increase profitability magically. They increase profitability by enforcing discipline.
When kitchens track contribution margin, refunds, delays, ratings volatility, and inventory variance profits stop being accidental.
If you want to see how dashboards fit into professional operations, start with:
Cloud Kitchen Operations Framework
See this – LinkedIn.
FAQs: Data & Dashboards for Cloud Kitchen Profitability
Do small cloud kitchens really need dashboards?
Yes. Small kitchens need dashboards more than large ones because even small leakages destroy margins.
How often should dashboards be reviewed?
Daily for key alerts (refunds, delays), weekly for profitability and ratings trends.
Can dashboards replace experience?
No. Dashboards support experience by removing blind spots and validating decisions with data.
What is the first metric I should track?
Contribution margin per order. Without this, growth is meaningless.
- Cloud Kitchen Business in India
- Cloud Kitchen Operations Framework
- Cloud Kitchen SOP Checklist
- Cloud Kitchen Setup Cost in India
- Cloud Kitchen Profit Margin in India
- Why Cloud Kitchens Fail in India
- Cloud Kitchen Consultant in India
- CKaaS Explained
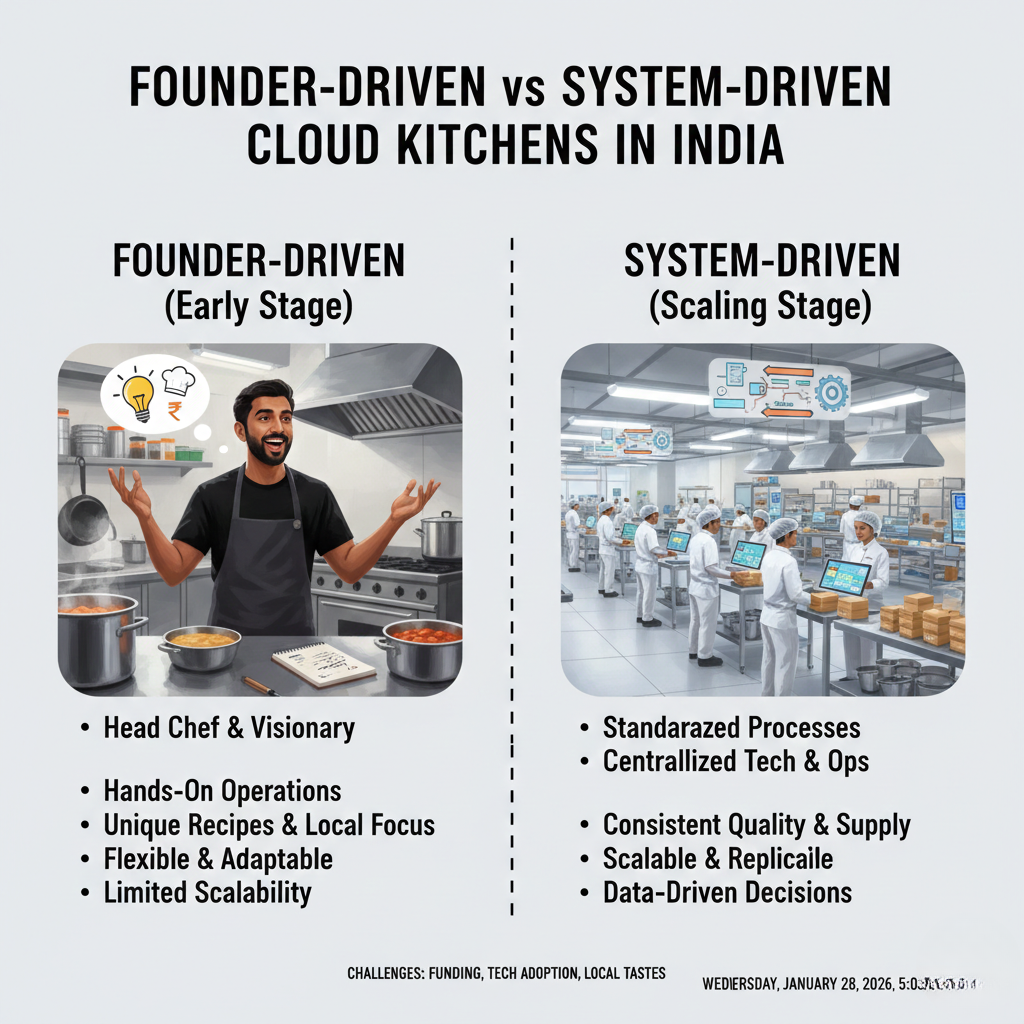
Most cloud kitchens in India start as founder-driven vs system-driven cloud kitchens businesses. The founder controls recipes, checks portions, manages staff, handles vendor gaps, fixes customer complaints, and pushes service during peak hours. This works at one kitchen but collapses during growth. Scaling a cloud kitchen requires a shift from founder-driven execution to system-driven operations where outcomes are predictable without constant intervention. This guide explains the transition from founder-driven to system-driven cloud kitchens, why most founders get stuck, and how operators build kitchens that run on systems, not daily firefighting.
Start Here Before Trying to Remove Yourself From Operations
This article is part of GrowKitchen’s operations and scaling series. If you are still validating your first kitchen, start with: Cloud Kitchen Business in India.
System-driven kitchens depend on food safety, documentation, and repeatable execution. Ensure compliance with FSSAI norms and structured staff training under FoSTaC before attempting scale.
The Founder-Driven Phase: Why It Feels Necessary
In the early days, founder involvement feels essential. You know the recipes, understand quality, and care more than anyone else.
Founder-driven execution often includes:
- Manual portion correction
- On-the-spot recipe tweaks
- Personal supervision during peaks
- Direct handling of refunds and complaints
This phase is normal. The problem begins when the business never evolves beyond it.
Why Most Founders Struggle to Let Go
The shift to system-driven operations is emotionally difficult. Founders fear quality loss and customer complaints.
Common reasons founders stay involved:
- “No one will care like I do”
- “Staff won’t follow processes”
- “Systems slow things down”
- “I’ll step back after expansion”
In reality, expansion without systems increases dependence on the founder.
What a System-Driven Cloud Kitchen Actually Means
A system-driven kitchen delivers consistent outcomes regardless of who is on shift.
This does not mean removing people. It means removing ambiguity.
System-driven kitchens rely on:
- Documented SOPs for every station
- Measured portions, not estimates
- Defined prep cycles and batch logic
- Clear dispatch and packing flows
- Regular KPI reviews
SOPs Are the Backbone of System-Driven Kitchens
Without SOPs, systems don’t exist. There is only memory and habit.
Effective SOPs cover:
- Prep quantities and timing
- Cooking sequence and heat control
- Packing order and labeling
- Dispatch handoff and escalation
Use this as your base reference: Cloud Kitchen Operations Framework. Facebook.
KPIs Replace Founder Intuition
Founder-driven kitchens rely on instinct. System-driven kitchens rely on data.
Key metrics include:
- Contribution margin per order
- Refund and remake rate
- Order delay percentage
- Rating variance by shift
- Inventory variance
Tracking these weekly removes the need for constant founder presence. Learn margin tracking here: Cloud Kitchen Profit Margin in India.
Why Systems Fix the “People Problem”
Founders often blame staff inconsistency. Systems reveal the real issue.
When expectations are clear and measurable:
- Training becomes faster
- Errors reduce naturally
- Accountability improves
- Performance becomes predictable
Systems don’t replace people. They enable average teams to perform consistently.
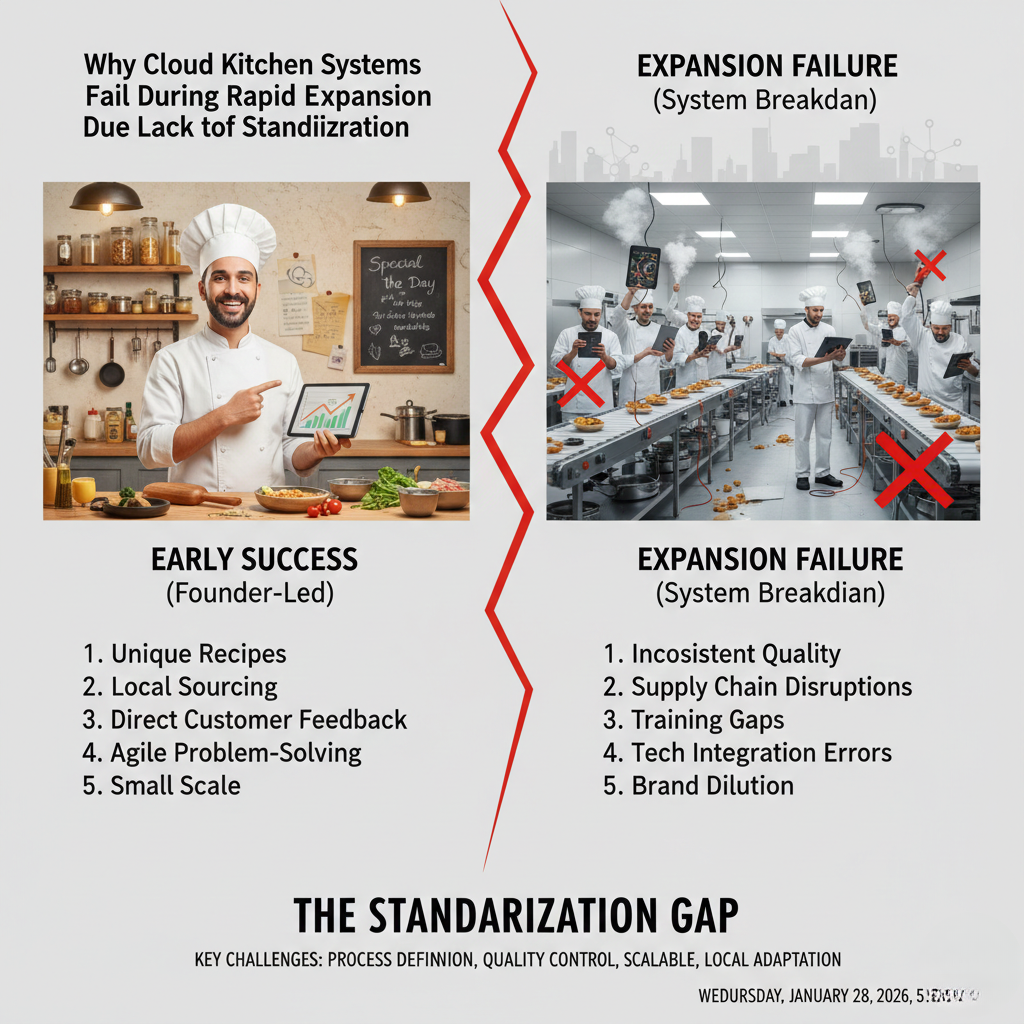
Why System-Driven Kitchens Scale Safely
Expansion fails when founders try to clone themselves.
System-driven kitchens scale by:
- Transferring SOPs, not habits
- Replicating menus, not improvisation
- Using KPIs instead of supervision
This difference explains why replication often fails: Why Replication Fails in Cloud Kitchen Expansion.
Final Thoughts: Let Systems Carry the Business
Founder-driven execution is heroic but unsustainable. System-driven execution is boring but scalable.
The most successful cloud kitchens in India are not run by exceptional founders every day, but by average teams guided by strong systems.
Build systems early. Let the business grow without consuming you.
FAQs: Founder-Driven vs System-Driven Cloud Kitchens
When should a founder step back from daily operations?
Once SOPs, KPIs, and menu systems deliver consistent results without intervention.
Do systems reduce food quality?
No. Systems protect quality by removing inconsistency and human error.
Can small kitchens become system-driven?
Yes. Systems matter more at small scale because margins are thinner.
Is system-building expensive?
No. Most systems are documentation and discipline, not capital investment.